
Sentiment Analysis with Python 3: just another example
After re-reading my last two posts on this topic, I felt like they were a little unfocused. I’m going to take one more shot at putting simple realistic example out there.
Background
In this post I pointed out a couple of first-pass issues with setting up a sentiment analysis to gauge public opinion of NOAA Fisheries as a federal agency. The main issues I came across were:
-
the default Naive Bayes Classifier in Python’s NLTK took a pretty long-ass time to train using a data set of around 1 million tweets. Hell, it took like 15 minutes to train on a data set of 10,0000 tweets.
-
it’s not immediately clear to me what to do about links and news stories. If somebody says, “check out this new announcement from NOAA Fisheries https://www.linktopressrelease.com” should this get classified as positive, negative, or thrown out?
-
related to number 2 above: I think the tweets that one would want to include in the sentiment analysis should filter out retweets and possibly filter out @ mentions that are just providing a link to some other source and not commenting on the link in any informative way…I’m not sure exactly how to do that (yet) but I’m pretty confident it can be done.
For now, let’s assume that problems 2 and 3 have been solved. Let’s also assume that problem 1 is not really an issue…imagine that we just let the training algorithm run overnight and the next morning we had a fully trained text classifier ready to rock and roll.
Research Questions/Motivation
In my last two posts I suggested that the motivating questions were:
- can I automate a process to pull tweets mentioning NOAA Fisheries directly from Twitter?, and
- can I use Python’s NLTK to train a machine learning algorithm to classify those tweets as ‘positive’ or ‘negative’?
The answer on both counts was ‘yes’ and ‘it’s not too difficult…in fact, depending on the exact application, you might be able to pull code right off the internet to do it.’
Let’s consider the two questions above to be a single process and assume that I’ve built a ‘machine’ capable of (i) going to Twitter and performing a search for tweets including ‘@NOAAFisheries’ over some time period and (2) taking those tweets and classifying them as ‘positive’ or ‘negative’. The more important question than can we do it? is why would we want to do it?
Here are two totally hypothetical, but reasonably realistic and interesting uses for the ‘NOAA Twitter Sentiment Analysis Machine’:
-
In April of 2010 a well-head blowout at BP’s Macondo Prospect created what is now commonly referred to as The Deepwater Horizon Oil Spill in the Gulf of Mexico. Massive sections of the Gulf of Mexico were closed to fishing and recreation for several months resulting in large-scale economic damages. Suppose that, due to arbitrary reasons I’m totally making up, it was difficult for commercial fishermen and charter boat operators to verify lost income using state and federal tax returns. As part of its responsibilities under the Magnuson-Stevens Fishery Conservation and Management Act, NOAA Fisheries collects various flavors of socio-economic data on commercial and recreational fishing in the U.S. Suppose that economic and financial data collected by NOAA Fisheries was instrumental in helping fishermen verify damages claims and seek compensation from BP for those economic damages. Suppose that NOAA Fisheries was recognized in the media for their role in providing data that was helpful in getting fishermen reimbursed for damages inflicted on them by a careless and negligent international oil company. One might be interested in whether a ‘positive’ media event (like getting some good press for helping out hardworking watermen) improves public sentiment about the agency. From the NOAA Fisheries perspective this is basically like asking, “does the public have a more favorable opinion of what we do when they know more about what we do?”…i.e. does outreach matter?
-
Another totally made up example: suppose that when President Obama decided to use the Outer Continental Shelf Lands Act to protect massive sections of the Artic from oil and gas development he put out a press-release that said, “After consulting with the brilliant scientists and tireless public servants at NOAA Fisheries, I agree with their assessment that off-shore oil and gas development poses a series risk to sensitive marine habitat. The risk of adverse impacts on commercially valuable fish species and protected marine mammals from oil and gas exploration is too great. Therefore we must protect the delicate marine ecosystems of the Chukchi and Beaufort seas by permanently banning oil and gas exploration in these areas.” I’m guessing that such an announcement would prompt more than a few negative tweets directed at NOAA from those in favor of expanding off-shore oil and gas drilling…and probably a host of positive tweets from those opposed to expanding off-shore oil and gas drilling (or those in favor of expanding the scope of environmental protections). Suppose that, in addition to classifying tweets as ‘positive’ or ‘negative’, we also tracked where the tweet was from (perhaps by using each users Twitter profile like I did here). With the ‘NOAA Twitter Sentiment Analysis Machine’ we built, we could also look at where sentiment is rising or falling in relation to particular news items.
Tracking Sentiment
Let’s start with a super simple sentiment metric: total ‘positive’ mentions divided by total mentions,
\[S=\frac{m^{p}}{m^{p}+m^{n}}\]where \(m^{p}\) is number of positive mentions and \(m^{n}\) is number of negative mentions.
To track sentiment over time let’s assume that:
- we start with a baseline score, \(S_{t-1}=\frac{m_{t-1}^{p}}{m_{t-1}^{p}+m_{t-1}^{n}}\)
- each week we run our script which classifies all the new tweets since last week and we get \(m_{t}^{p}\) and \(m_{t}^{n}\) and calculate the new Sentiment Score.
The following chunk of code (just copy-pasted from the last two posts) will
- pull the NOAAFisheries tweets for the current week
- classify them
import tweepy
#--------------------------------------------------------------
#set up API parameters
consumer_key = ''
consumer_secret = ''
access_token = ''
access_secret = ''

auth = OAuthHandler(consumer_key, consumer_secret)
auth.set_access_token(access_token, access_secret)

api = tweepy.API(auth)
#-----------------------------------------------------------------

#----------------------------------------------------------------
tweet=[]
for tweet in tweepy.Cursor(api.search, q="@NOAAFisheries-filter:retweets").items():
    #Write a row to the csv file/ I use encode utf-8
    csvWriter.writerow([tweet.created_at, tweet.text.encode('utf-8')])
    print tweet.created_at, tweet.text
csvFile.close()
#-------------------------------------------------------------------

#---------------------------------------------------------------------
#read in the data frame where the new tweets are stored
noaa_tweets = pd.read_csv('/Users/aaronmamula/Documents/blog posts/result.csv')

#format the tweets and create a list that just has the text of the tweet
tlist = []
for t in tweets:
    t_new=re.sub('[^A-Za-z0-9]+', ' ', t)
    tlist.append(t_new)
    print(t_new)
#-----------------------------------------------------------------------

#-------------------------------------------------------------------
#classify each tweet from the most recent pull
sent=[]
for tweet in tlist:
    print classifier.classify(extract_features(tweet.split()))
    tweet_now=classifier.classify(extract_features(tweet.split()))
    sent.append(tweet_now)

#-------------------------------------------------------------------

#-------------------------------------------------------------------
#get the number of positive tweets, negative tweets, and total tweets
# from the most recent batch
p=sum(i=='positive' for i in sent)
n=len(sent)-p

#-------------------------------------------------------------------
To update the Sentiment Score let’s suppose that I have the Sentiment Score from previous data pulls saved in a .csv that I update every week. So now I’m going to:
- read in the sentiment data frame
- add a row for the new Sentiment Score
#read in the Sentiment Score file
sent_score=pd.read_csv('/Users/aaronmamula/Documents/Python/SentimentAnalysis/sentscore.csv')
sent_score.head()
            pos  total
2016-12-19   50    100
2016-12-26  103    200

#add a row with the new Sentiment Score Values:
new_row = {'pos' : pd.Series([p], index=['2017-01-02']),
	'total' : pd.Series([len(sent)], index=['2017-01-02'])}

new_row=pd.DataFrame(new_row)

sent_score.append(new_row)
sent_score.head()

            pos  total
2016-12-19   50    100
2016-12-26  103    200
2017-01-02   77     91

#write the updated Sentiment Score file back to the .csv
sent_score.to_csv("/Users/aaronmamula/Documents/Python/SentimentAnalysis/sentscore.csv", cols=('pos','total'))
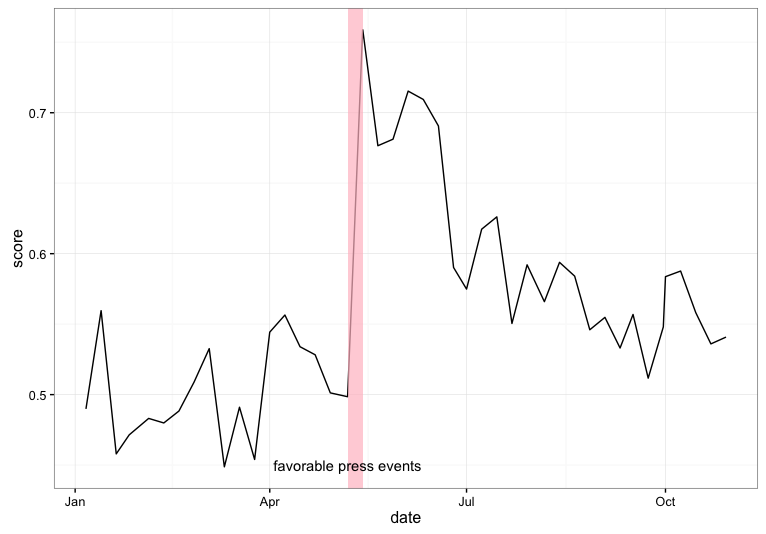
So getting back to my hypothetical example number 1, suppose I had been monitoring and classifying tweets each week…and saving the data to a .csv file as illustrated above. Now I want to compare the dynamics of that sentiment score to the locations in time of news events. A great first step would just be to plot that score over time and overlay some markers for noteworthy events.
Suppose that roughly a month after the start of the Deepwater Horizon oil spill, the press began reporting on the use of data collected by NOAA Fisheries to help fishermen in the Gulf validate their claims of economic damages imposed by BP. Specifically, suppose that around the second week in May of 2010, news outlets began favorably mentioning NOAA Fisheries in stories about the impact of the oil spill on local fishermen.
Some things that data people might be interested in:
- how was (or was) NOAA Fisheries’ sentiment score influenced by positive press?
- how quickly or slowly did the positive ‘bump’ wear off?
- was there a sustained increase in Twitter mentions following the positive press?
These questions can all be addressed with the representative data frame I illustrated above.
Note that number 3 isn’t as much about the Sentiment Score as much as just the volume of activity…volume is probably an important thing to track along with the actual Sentiment Score. Much the way price movements in the stock market are considered to be a more meaningful signal about underlying market sentiment if they occurred on ‘high volume’ rather than ‘low volume’, I imagine that a Sentiment Score increase of a few percentage points would mean more if the total volume of activity was also picking up.
Final Thoughts
I don’t have any particularly enlightened final commentary on this post. My goal for this little 3 part series was to illustrate that a bargain variety sentiment analysis using Twitter data can be accomplished without too much hassle. For this post in particular I wanted to go one step beyond, “can it be done” and do a little thinking out loud on the related question, “why should it be done?”
I’m becoming increasingly convinced that there are some really cool potential applications of Twitter Scraping and Sentiment Analysis in the realm of things I get paid to work on (environmental science and policy). Obviously, I still have to flush out many, many, many of the details of a Sentiment Analysis in general…but at least now I know that the underlying mechanics aren’t totall out of reach.
Appendix
For completeness, here is the full annotated scripts that I used to:
- get tweets mentioning @NOAAFisheries via the tweepy module in python
- use a set of ‘training tweets’ to train a Naive Bayes Binary Text Classifier using the NLTK module
- use the trained classifier to labels the @NOAAFisheries tweets as either ‘positive’ or ‘negative’
#import necessary modules
import tweepy
import csv
import re
import io
import pandas as pd
import nltk
import numpy as np
import random

##################################################################
# Use tweepy to search Twitter for mentions of @NOAAFisheries

#--------------------------------------------------------------
#set up API parameters
consumer_key = ''
consumer_secret = ''
access_token = ''
access_secret = ''

auth = OAuthHandler(consumer_key, consumer_secret)
auth.set_access_token(access_token, access_secret)

api = tweepy.API(auth)
#-----------------------------------------------------------------

#----------------------------------------------------------------
#Open a .csv and write results of our Twitter search to a .csv file
csvFile = open('result.csv', 'a')
csvWriter = csv.writer(csvFile)

for tweet in tweepy.Cursor(api.search, q="@NOAAFisheries-filter:retweets").items():
    #Write a row to the csv file/ I use encode utf-8
    csvWriter.writerow([tweet.created_at, tweet.text.encode('utf-8')])
    print tweet.created_at, tweet.text
csvFile.close()
#-------------------------------------------------------------------
#######################################################################

#######################################################################
#Set up the test data: here we just read in the tweets that we saved to a
# .csv earlier and clean it a little (remove punctuation and species characters)

noaa_tweets = pd.read_csv('/Users/aaronmamula/Documents/blog posts/result.csv')

noaa_tweets.head()
print(noaa_tweets.iloc[:,1])
tweets = noaa_tweets.iloc[:,1]

tlist = []
for t in tweets:
    t_new=re.sub('[^A-Za-z0-9]+', ' ', t)
    tlist.append(t_new)
    print(t_new)
#########################################################################

#########################################################################
#Train the text classifier:

#this happens in a few parts:

#---------------------------------------------------------------------
#read in the training data and clean it some.
# the training data comes from:
# https://inclass.kaggle.com/c/si650winter11/data

training_tweets = pd.read_csv('/Users/aaronmamula/Documents/Python projects/sentimentanalysis/Sentiment Analysis Dataset.csv')
training_tweets['sent'] = np.where(training_tweets['Sentiment']==0, 'negative', 'positive')

#it is taking way too long to train this classifier using all
# 1 million training tweets...I'm going to subset the data
rows = random.sample(training_tweets.index, 10000)

training_tweets=training_tweets.ix[rows]
#-----------------------------------------------------------------------

#----------------------------------------------------------------
#subset the training set and convert it to a list of tuples

training_set=training_tweets[['SentimentText','sent']]
tuples=[tuple(x) for x in training_set.values]
#-----------------------------------------------------------------

#-----------------------------------------------------------
#convert everything to lowercase and remove common stop words
# that are shorter than 3 characters...also remove
# punctuation...this might not be optimal in the long-run
# but at them moment I'm anticipating a lot of problems
# with punctuation in our training set

tweets = []
for (words, sentiment) in tuples:
    words_filtered = re.sub('[^A-Za-z0-9]+', ' ', words)
    words_filtered = [e.lower() for e in words_filtered.split() if len(e) >= 3]
    tweets.append((words_filtered, sentiment))
#-----------------------------------------------------------

#-----------------------------------------------------------
# define some helper functions to help us set up the dictionary
# for the NLTK package
def get_words_in_tweets(tweets):
    all_words = []
    for (words, sentiment) in tweets:
      all_words.extend(words)
    return all_words

def get_word_features(wordlist):
    wordlist = nltk.FreqDist(wordlist)
    word_features = wordlist.keys()
    return word_features

word_features = get_word_features(get_words_in_tweets(tweets))

def extract_features(document):
    document_words = set(document)
    features = {}
    for word in word_features:
        features['contains(%s)' % word] = (word in document_words)
    return features
#---------------------------------------------------------------

#----------------------------------------------------------------
#create the training set and pass it to the Naive Bayes classifier for
# training

#this creates a set of T/F entries for every tweet in the training
# set.  The T/F outcomes indicate which features contained in the
# training set are present in each training tweet
training_set = nltk.classify.apply_features(extract_features, tweets)

#```````````````````````````````````````````````````````````````
#a little debugging

#Let's have a look at this traning_set object...it's too big to print
# to the console so I'll print it to a text file and open in an editor
import json

t1=training_set[1]
t1=t1[0]

# save to file:
with open('/Users/aaronmamula/Documents/Python projects/sentimentanalysis/my_file.json', 'w') as f:
    json.dump(t1, f)
#````````````````````````````````````````````````````````````````

#now for some real black box shit:
tic = time.clock()
classifier = nltk.NaiveBayesClassifier.train(training_set)
toc = time.clock()
toc - tic
#---------------------------------------------------------------

#----------------------------------------------------------------
#test out our classifier on something trivial
tweet = 'Larry is my friend'
	...print classifier.classify(extract_features(tweet.split()))
#------------------------------------------------------------------