
Working with shapefiles in r suck it esri!
I have been looking at other peoples’ awesome R-powered geospatial analysis for what feels like years and, until now, every time I’ve sat down to try and do some spatial analytics in R I’ve been stymied by wierd package load errors. I’ve been poking around this problem rather casually for several months and last night I think I finally made some tangible progress. I’m pretty stoked about this so I hope you will be too.
Outline:
I got two things I think are worth sharing here. The first is some really tedious shit involved in getting set up to work with shapefiles in R if you’re working on a Mac. Like I said, this is tedious but it’s worth discussing because it has taken me quite a long time to get the right spatial libraries installed on my system….i.e. it’s not quite as straightforward as install.packages(‘rgeos’). In fact, for reasons I don’t totally understand it’s way more complicated than that.
The second thing I want to show you is a quick example of using R to join and display different types (shapefiles, SpatialPolygonsDataFrames, regular dataframes, etc).
Because the set up is necessary but boring, I’m going to present these two things in inverse order:
-
I’m goin to show you the cool shit first
-
Then I’ll walk through how to get the right tools set up.
A California Insurance Example
The crucial libraries you need in order to work with shapefiles in the ggplot environment or even to convert R’s spatial objects (SpatialPolygonsDataFrame) to regular vanilla dataframes that are easier to manipulate are:
- rgdal
- rgeos
For the moment let’s assume those libraries have been successfully installed and loaded.
This exercise was shamelessly pirated from Kevin Johnson’s badass post.
As a proof-of-concept to verify that I could actually read-in and manipulate shapefiles in R I tried to reproduce Kevin’s map of insured vs. uninsured individuals by Census Tract. I made one tiny change: I used data for California instead of Georgia.
I got shapefiles for Census Tract Boundaries and California County Boundaries from the Cartographic Boundaries aisle of the Census Bureau’s TIGER Products web-mart. You can download the shapefiles
Or you can get them from the GitHub Repo I set up
In addition to county boundaries, I grabbed the estimated number of individuals with health insurance in California by Census Tract. This was a bit of a pain in the ass because the Census Bureau’s American Community Survey is notoriously difficult to navigate. You can try to get this series yourself if you want from the ACS website: to keep things simple I used Series B27001A, “Health Insurance Coverage Status by Age (Whites Only)” and I used the spatial resolution of Census Tract. I also have this data in a cleaned form in a .csv file in the GitHub repo. I suggest using my clean version first then branching out to other data files later.
library(rgdal)
library(ggplot2)
library(ggmap)
library(scales)
library(maptools)
library(rgeos)
library(dplyr)

#Read the Census Tract Boundaries for California
# note dsn is just the directory where the shapefile you want lives
tract <- readOGR(dsn = "data/gz_2010_06_140_00_500k",
                 layer = "gz_2010_06_140_00_500k")
tract <- fortify(tract, region="GEO_ID")

#Read in the .csv file with insured/uninsured individuals
ins <- read.csv("data/CA_insured_tract.csv")
ins$id <- as.character(ins$GEO.id)
ins$percent <- ins$Insured18_64/ins$Pop18_64

#clip the data and the shapefile boundaries
plotData <- left_join(tract, ins)

#A first plot
ggplot() +
  geom_polygon(data = plotData, aes(x = long, y = lat, group = group,
                                    fill = percent), color = "black", size = 0.25) +
        theme_bw()

#-------------------------------------------------------------
#Now let's overlay county boundaries instead of census tract
# boundaries since the census tract boundaries are kind of
# bleeding together and making shit hard to see
county <- readOGR(dsn = "data/gz_2010_06_060_00_500k",
                  layer = "gz_2010_06_060_00_500k")
county <- fortify(county, region="COUNTY")

p <- ggplot() +
  geom_polygon(data = plotData, aes(x = long, y = lat, group = group,
                                    fill = percent)) +
  geom_polygon(data = county, aes(x = long, y = lat, group = group),
               fill = NA, color = "black", size = 0.25) +
  coord_map() + theme_bw()

#now I'm going to use the scales() package to bin the data a little
# so the contrasts in coverage rates are a little more visible
ggplot() +
  geom_polygon(data = plotData, aes(x = long, y = lat, group = group,
                                    fill = percent)) +
  geom_polygon(data = county, aes(x = long, y = lat, group = group),
               fill = NA, color = "black", size = 0.25) +
  coord_map() +
  scale_fill_distiller(palette = "Greens", labels = percent,
                       breaks = pretty_breaks(n = 10)) +
  guides(fill = guide_legend(reverse = TRUE)) + theme_bw()
#---------------------------------------------------------------
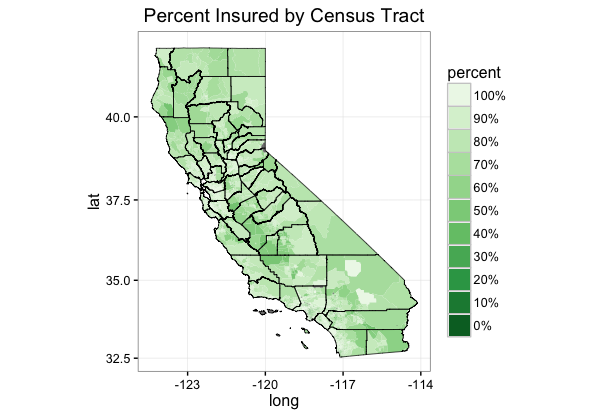
So what we get here is a really cool map of the percent of white people with ages 18-64 with health insurance in each California Census Tract. The map is displayed with county boundaries instead of Census Tract boundaries so it is easier to see some of the spatial contrasts in coverage rates.
Now for the boring shit
Getting the rgdal package installed on my R version was no problem…install.packages(‘rgdal’) worked just fine. The real sticking point for me was the rgeos package. It seems I am not alone in this regard:
Dr. Dyer astutely points out “there seems to be a nefarious conspiracy against packaging spatial R packages on the Mac platform.”
Just to be clear, there are plenty of people lurking on Stack Overflow waiting to tell users that they just need to install ‘rgeos’ from source rather than do a console install. This did not work for me:
install.packages("rgeos", repos="http://R-Forge.R-project.org", type="source")
trying URL 'http://R-Forge.R-project.org/src/contrib/rgeos_0.3-9.tar.gz'
Content type 'application/x-gzip' length 238246 bytes (232 KB)
opened URL
==================================================
downloaded 232 KB

* installing *source* package ‘rgeos’ ...
configure: CC: clang
configure: CXX: clang++
configure: rgeos: 0.3-8
checking for /usr/bin/svnversion... yes
cat: inst/SVN_VERSION: No such file or directory
configure: svn revision:
checking for geos-config... no
configure: error: geos-config not found or not executable.
ERROR: configuration failed for package ‘rgeos’
* removing ‘/Library/Frameworks/R.framework/Versions/3.1/Resources/library/rgeos’

In install.packages("rgeos", repos = "http://R-Forge.R-project.org",  :
  installation of package ‘rgeos’ had non-zero exit status
Here is what worked for me:
Following the direction here I download and installed the GDAL Complete frameworks for Mac. I got the complete framework here.
-
Download the latest source package of rgeos from https://r-forge.r-project.org/R/?group_id=602 (click the “Package source (.tar.gz)” link). You should see a *.tar.gz file in your downloads folder. Do not decompress the file (i.e. make it a folder). If Safari automatically decompressed it without asking you, try to ctrl+click on the link and save it to your downloads folder.
-
Install the rgeos package from the command line (terminal)
R CMD INSTALL /path-to-rgeos/rgeos_version.tar.gz --configure-args='--with-geos-config=/Library/Frameworks/GEOS.framework/unix/bin/geos-config'
Replace /path-to-rgeos/rgeos_version.tar.gz to point towards the directory and filename of the actual rgeos tarball you downloaded in step 1. For example for me, the path was /Users/aaronmamula/Downloads/rgeos_0.3-22.tar.gz. You can get the path of a file by selecting it in Finder and pressing command+I (Info window).
At this point I was pretty stoked that I finally had ‘rgeos’ installed and I figured I was out of the woods because I had been able to install ‘rgdal’ from a simple R Console Install. Well, I was wrong: I was not out of the woods. I tried to load rgdal and rgeos into a workspace and use them and I kept encountering this funky error message about gcplibPermitStatus() which I couldn’t get around…
When I re-installed rgdal from the GDAL Complete Framework the gpclibPermitStatus() issue went away. To get rgdal working properly I did another command line install:
R CMD INSTALL /path-to-downloads/rgdal_1.2-5.tar.gz --configure-args='--with-gdal-config=/Library/Frameworks/GDAL.framework/Programs/gdal-config --with-proj-include=/Library/Frameworks/PROJ.framework/Headers --with-proj-lib=/Library/Frameworks/PROJ.framework/unix/lib'