
Researcher degrees of freedom, gartley patterns, and porn
Andrew Gelman writes a lot about p-hacking and ‘researcher degrees of freedom.’ I like his writing, his academic work, and his blog. You should check it out. He’s a great statistician, a great political scientist, and a true scholar.
I’ve been thinking a lot lately about pattern trading and ‘technical stock analysis.’ I’ve also been monkeying with a lot of stock market data…since I rarely think about anything without trying to distill it down to a collection of charts and code. I’ve been struggling to put into words why I find a lot of “chart pattern trading” unsettling…then it occurred to me that ‘researcher degrees of freedom’ comes pretty close to describing why I think stock market chart pattern trading is total voodoo.
First, an excerpt from the paper that brought us the term, “Researcher Degrees of Freedom”, Simmons et al. 2011:
It is unacceptably easy to publish “statistically significant” evidence consistent with any hypothesis.
The culprit is a construct we refer to as researcher degrees of freedom. In the course of collecting and analyzing data, researchers have many decisions to make: Should more data be collected? Should some observations be excluded? Which conditions should be combined and which ones compared? Which control variables should be considered? Should specific measures be combined or transformed or both?
It is rare, and sometimes impractical, for researchers to make all these decisions beforehand. Rather, it is common (and accepted practice) for researchers to explore various analytic alternatives, to search for a combination that yields “statistical significance,” and to then report only what “worked.” The problem, of course, is that the likelihood of at least one (of many) analyses producing a falsely positive finding at the 5% level is necessarily greater than 5%.
Here is the lightening round overview of today’s post:
Technical analysis is a generic term for trading in markets (equity markets, commodity futures markets, currency markets, whatever) according to technical indicators (moving averages, Bollinger Bands, etc) as opposed to more traditional ‘fundamental’ analysis that is generally more concerned with a company’s PE ratio, debt ratios, gross margins, or whatever.
Pattern trading is related to technical analysis but it involves looking at charts of equity/commodity/currency prices and trying to infer whether to buy or sell the underlying thing according to information in the chart.
A long-ass time ago a dude named H.M. Gartley wrote a book called Profits in the Stock Market. There was a chart pattern in that book that technical traders are quite fond of and talk about all the time. Many people just call it “The Gartley” but, for precision, I’ll call it the “Gartley 222” because that’s how I’ve seen it differentiated from the other patterns in Gartley’s book (the pattern I’m talking about was discussed on page 222 of the book).
Some very high profile and successful traders like Larry Pesavento have made claims stating that 70% of trades based on Gartley 222 patterns are profitable. In this post I’m going to try and set up a test of this claim. And lest you think I’m setting up a strawman here, please feel free to google “trading gartley patterns”…you’ll find countless books (The Art of Timing the Trade, Trade What You See) and endless websites dedicated to teaching you how to identify and profit from Gartley patterns.
Executive Summary
Here are the main things my inquiry has turned up:
-
The claim that “the Gartley 222 pattern has a 70% success rate” is both totally meaningless and absolute nonsense.
-
The reason, in my humble opinion, behind many of these asinine claims of Gartley success is RESEARCHER DEGREES OF FREEDOM (RDF).
-
Some technical traders are total snake oil salesmen trying to get you to buy a shitty piece of technical analysis software and then pay them to teach you how to use it in ‘webinars.’ Don’t do this. Ever. You want to learn to tape-read or trade off of chart patterns? Like Jesse Livermore or Wycoff That’s cool, I won’t say a bad word about you. But please, please, please don’t ever poney up a grand for some dude’s “Gartley screener.”
-
Most technical traders are not snake oil salesmen, they’re just honest guys trying to make a living doing something that interests them.
-
A good portion of technical financial educators (Larry Pesavento, Scott Carney, etc) are great and very interesting guys. They generally are not trying to swindle you…they really do believe that Fibonacci numbers and being able to connect data points on a chart to look like a crab or bat have some significance in the movement of market prices.
-
Fibonacci retracements are actually about as informative and predictive as the ratio of M&Ms to cashews in a random bag of trail mix.
Reader Alert
Upon re-reading this it sounds a little like I’m bashing Tom O’Brien and Larry Pesavento. I’m not or at least I don’t mean to. They are both intensely interesting dudes, I subscribe to both their daily podcasts and I rarely miss one. I’m also a paying subscriber to Tom O’Brien’s trading newsletter. I am still convinced that
- Gartley chart patterns are total kaka
- Fibonacci retracements are meaningless, and
- Astrological trading is a comically bad undertaking
but that doens’t mean I think the people who do these things are criminals or idiots. Totally the opposite actually. At least in the case of O’Brien and Pesavento they do make a lot of money with their systems, they genuinely want to help you make money, they really want to help you understand their system…the issue that I will discuss further in this post is that they may or may not realize how untethered their systems are to quantifiable metrics like Gartley patterns or Fibonacci retracements.
The Gartley 222 and RESEARCHER DEGREES OF FREEDOM
Ok, let’s get started.
The hypothesis we are looking to test is the claim that the Gartley 222 pattern has a 70% success rate. So the first thing we need to do define what a Gartley 222 pattern is. The figure below illustrates what I claim is the most common understanding of a Gartley sell signal.
#first gotta load some quantative finance stuff I wrote
require(ggplot2)
require(dplyr)
require(lubridate)
require(zoo)
require(quantmod)
require(data.table)
library(ggthemes)
############################################################################
############################################################################
############################################################################
#Use QuantMod package to pull quotes from Yahoo Finance

df.pull <- function(tickers,startDate,endDate){
  stockData <- new.env() #Make a new environment for quantmod to store data in

  #create a character vector of ticker symbols to pull data for
  #tickers <- c("FCNTX","PRNHX","FSENX","VGPMX","BAC","SPY","^GSPC", "^DJI","^RUT",
  #             "FSCOX","XLF") #Define the tickers we are interested in

  #some small and mid-cap growth funds
  #tickers <- c('BUFTX','FCPGX','FDEGX','IWB','FMCSX','VISGX','VMGRX')

  #some diversified emerging markets
  #tickers <- c('FEMKX','FEDDX','PRMSX','VEIEX','FSCOX')


  #Download the stock history (for all tickers)
  getSymbols(tickers, env = stockData, src = "yahoo", from = startDate, to = endDate)

  #first coerce the environment to a data frame....this gives us a list of
  # data frames
  df2 <- eapply(stockData,as.data.frame)

  #now if we change the column names in each of the list objects we can use
  # rbindlist to get them in a single data frame...the problem  here is that
  # the assets are not in the data frame 'df2' in the same order I put them in
  # the object 'tickers'.  For each data frame in the list I need to recover the name
  # of the asset and also give the columns new names.
  df.clean <- function(tmp.data){
    asset <- unlist(strsplit(names(tmp.data)[1],"[.]"))[1]
    names(tmp.data) <- c("Open","High","Low","Close","Volume","Adjusted")
    tmp.data$asset<-asset
    tmp.data$date <- as.Date(row.names(tmp.data),format="%Y-%m-%d")
    return(tmp.data)
  }
  #apply the function above to each element in the df2 list...then coerce the output
  # to a data frame
  return(tbl_df(data.frame(rbindlist(lapply(df2,df.clean)))))
}
##########################################################################################


#first I'm just going to draw the perfect Gartley
X <- 2
A <- 1
XA <- abs(X-A)
AB <- 0.618*XA
B <- A + AB
BC <- 0.618*AB
C <- B - BC
AD <- 0.786*XA
D <- A + AD
targ <- D - (0.618*(D-C))

g.df <- data.frame(y=c(X,A,B,C,D),x=c(1,3,5,7,9))
ggplot(g.df,aes(x=x,y=y)) + geom_line() +
  annotate("text",x=1,y=2.1,label="X") +
  annotate("text",x=3,y=0.91,label="A") +
  annotate("text",x=5,y=1.7,label="B") +
  annotate("text",x=7,y=1.22,label="C") +
  annotate("text",x=9,y=1.8,label="D") +
  annotate("text",x=5,y=2,label="Sell Mortimer, Sell!") +
  geom_segment(aes(x=1,y=1.446,xend=9,yend=1.446),color="blue",linetype='dotted') +
  annotate("text",x=7,y=1.6,label="profit target = D - 0.618*|D-C|") +
  geom_segment(aes(x=5.2,y=1.9,xend=8.7,yend=1.8),
               color="red",
               arrow = arrow(length = unit(0.1,"cm"))) +
    theme_bw() +
  theme(axis.text.x=element_blank()) +
  xlab("") + ylab("price")
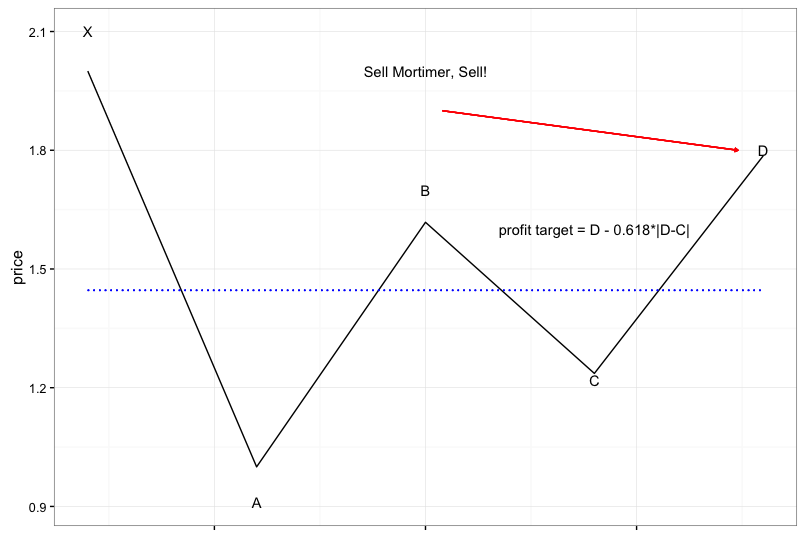
In the chart above the dotted blue line indicates a commonly cited profit target at D - 0.618(D-C) for a sell signal or D + 0.618(D-C) for a buy signal.
As I understand it the Gartley 222 should have:
- an impulse leg X to A
- a rebound at A such that absolute value of A-B = 0.618 time absolute value X-A
- a retracement at B such that absolute value B-C = 0.618 times absolute value A-B…another common retracement is 0.786 time absolute value A-B
- a reversal at C such that absolute value C-D = 1.27 or 1.618 times absolute value B-C
- a D point such that absolute value A - D = 0.786 time absolute value X - A
Common invalidations of a Gartley:
- The C point should not fall below the A point
- The D point should not rise above X
Note, if you don’t like the Gartley Rules I laid out here don’t worry. We are now going to look at some real world Gartley examples from prominent sources and you’ll see that all of them, despite being sold as ‘text book Gartley’s’ fudge at least one of the well known conditions for a Gartley.
Gartley Example 1:
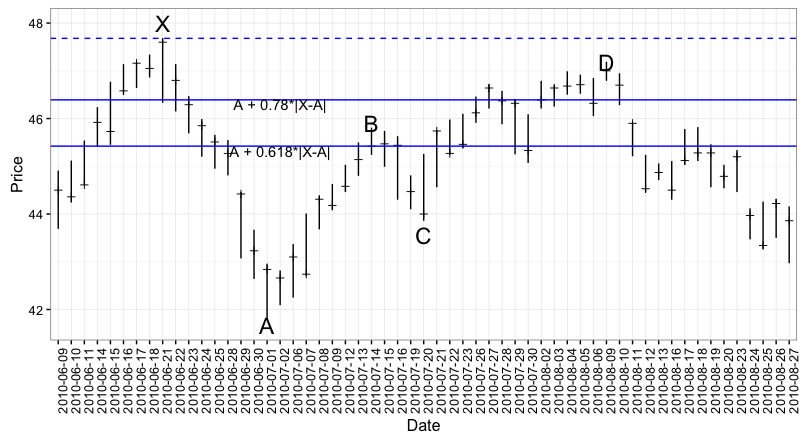
I’ll start with the Gartley example from Tom O’Brien’s book The Art of Timing the Trade. He says that the QQQ (The ETF that tracks the Nasdaq 100) formed a Gartley ‘sell’ pattern between 6/18/2010 and 8/9/2010.
#make sure to get the quantmod package loaded so you can pull stock prices
library(quantmod)

#the QQQ example from Tom's book
qqq <- df.pull(tickers="QQQ",startDate='2010-06-09',endDate='2010-08-27')

ggplot(data=qqq, aes(x=factor(date))) +
  theme_bw() +
  geom_linerange(aes(ymin=Low,ymax=High)) +
  geom_point(aes(x=factor(date),y=Open),shape=3)

X <- qqq$High[qqq$date=='2010-06-21']
A <- qqq$Low[qqq$date=='2010-07-01']
B <- qqq$High[qqq$date=='2010-07-14']
C <- qqq$Low[qqq$date=='2010-07-20']
D <- qqq$High[qqq$date=='2010-08-09']

BC.rt <- B - ((B-A)*0.32)
f79 <- A + ((X-A)*0.782)
f60 <- A + ((X-A)*0.618)
fC38 <- B - ((B-A)*0.318)
fC88 <- B - ((B-A)*0.886)

ggplot(data=qqq, aes(x=factor(date))) +
  theme_bw() +
  geom_linerange(aes(ymin=Low,ymax=High)) +
  geom_point(aes(x=factor(date),y=Open),shape=3) +
  geom_hline(yintercept=X,color="blue",linetype='dashed') +
  geom_hline(yintercept=f79,color="blue") +
  geom_hline(yintercept=f60,color="blue") +
#  geom_hline(yintercept=fC38,color="pink") +
#  geom_hline(yintercept=fC88,color="pink") +
  annotate("text",x='2010-06-21',y=48.00,label="X",size=6) +
  annotate("text",x='2010-07-01',y=41.67,label="A", size=6) +
  annotate("text",x='2010-07-14',y=45.90,label="B",size=6) +
  annotate("text",x='2010-07-20',y=43.56,label="C",size=6) +
  annotate("text",x='2010-08-09',y=47.18,label="D",size=6) +
  annotate("text",x='2010-07-02',y=46.30,label="A + 0.78*|X-A|") +
  annotate("text",x='2010-07-02',y=45.32,label="A + 0.618*|X-A|") +
  theme(axis.text.x=element_text(angle=90)) +
  xlab("Date") + ylab("Price")
-
$\frac{B-A}{X-A} = 0.683$ which is neither 0.618 or 0.786…but it is between those two so let’s be generous and say the Fibonacci retracement for the A to B leg of our Gartley should be ‘between 0.618 and 0.786.’
-
$\frac{B-C}{B-A}$ = 0.4826. Here we get to the real ambiguity of the Gartley pattern. Some sources say B to C should be a 0.618 or a 0.786 retracement of the A - B move. Other sources say that B to C can be anywhere from 0.328 to 0.886 times the A to B move.
-
Finally, in this example $\frac{D-A}{X-A} = 0.9171$ which is a pretty far cry from the recommended 0.786.
A quick rant: Tom O’Brien is really adement in his book that a Gartley 222 pattern MUST HAVE an AB=CD structure. I have seen this language in other places as well and it is an infuriating bit of poo. AB=CD is not a structure, it is a statement…and in the case of the QQQ example above it is a verifiably false statement.
I think these technical traders are using the word ‘structure’ in the phrase “AB=CD structure” to connote that AB=CD should not be taken literally but rather that a Gartley should have AB and CD legs that are similar.
I wish they would just say that because “AB=CD structure” is a completely meaningless pile of poppycock. AB is either equal to CD or it is not. There is no structure involved.
Gartley Example 2:
On page 222 of Tom’s book he provides an example of a Gartley buy pattern. This pattern emerged with the equity FCX (Freeport-McMoran) between July 6, 2009 and June 28, 2010. Per The Art of Timing the Trade:
- The “X” point occurred on the week of July 6, 2009 at $42.14
- The “A” point occurred on the week of Jan 11, 2010 at $88.36.
- The “B” point occurred on the week of Feb 1, 2010 at $64.54
- The “C” point is the week of April 5, 2010 at $86.31
- The “D” point is the week of June 28, 2010 at $55.53
These numbers give us:
- (A-B)/(X-A) = 0.51 not quite the 0.618 we are supposed to be looking for but let’s keep an open mind.
- (C-B)/(A-B) = 0.91…a little higher than the 0.786 retracement we were told to be on the lookout for.
- (A-D)/(A-X) = 0.71…this one is about right.
Gartley Example 3:
This one come from the internet so take it for what it’s worth. A site called Trader’s Library has an example of a bullish Gartley that presented itself in the chart of Lockheed-Martin between November 12th and December 14th of 2012.
lmt<-df.pull(tickers="LMT",startDate='2012-11-01',endDate='2013-01-01')
ggplot(data=lmt, aes(x=factor(date))) +
  theme_bw() +
  geom_linerange(aes(ymin=Low,ymax=High)) +
  theme(axis.text.x=element_text(angle=45))

X <- lmt$Low[lmt$date=='2012-11-15']
A <- lmt$High[lmt$date=='2012-11-30']
B <- lmt$Low[lmt$date=='2012-12-05']
C <- lmt$High[lmt$date=='2012-12-11']
D <- lmt$Low[lmt$date=='2012-12-17']


ggplot(data=lmt, aes(x=factor(date))) +
  theme_bw() +
  geom_linerange(aes(ymin=Low,ymax=High)) +
  geom_hline(yintercept=X,color="blue",linetype='dashed') +
  geom_hline(yintercept=A -  (0.786*(A-X)),color="blue") +
  annotate("text",x='2012-11-28',y=(A-(0.768*(A-X)))-0.2,label="F 0.768") +
  geom_hline(yintercept=A - (0.618*(A-X)),color="blue") +
  annotate("text",x='2012-11-28',y=(A-(0.618*(A-X)))+0.2,label="F 0.618") +
  geom_hline(yintercept=B + (0.618*(A-B)),color="pink") +
  annotate("text",x='2012-11-15',y=87,label="X",size=6) +
  annotate("text",x='2012-11-30',y=94.05,label="A", size=6) +
  annotate("text",x='2012-12-05',y=B-0.05,label="B",size=6) +
  annotate("text",x='2012-12-11',y=C+0.05,label="C",size=6) +
  annotate("text",x='2012-12-17',y=D-0.05,label="D",size=6) +
  theme(axis.text.x=element_text(angle=90)) +
  ylab("Price") + xlab("Date")
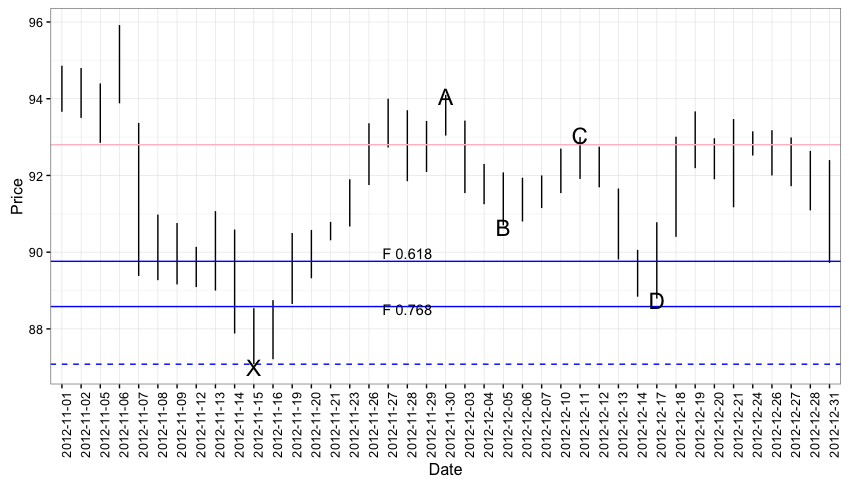
In this pattern we have:
- \[\frac{A-B}{A-X} = 0.484\]
- \[\frac{C-B}{A-B} = 0.676\]
- \[\frac{A-D}{A-X} = 0.75\]
Summary
In sum it seems that our rules for identifying a Gartley 222 looks vaguely like this:
- X - A should be a decent sized move
- A - B should be somewhere in the neighborhood of 40 - 70% of X - A.
- B - C (based on our three ‘text book’ examples) can apparently be anything from 50 - 90% of the A - B move
- A - D can be anything from 60 - 90% of X - A
This seems to me like pretty bad news for testing whether the Gartley really has a 70% success rate. Basically, it is starting to look to me like:
-
as long as you can find an oscillating price series with 2 peaks and 3 troughs (in the case of the bullish patterns) or 3 peaks and 2 troughs (in the case of the bearish pattern)…and
-
The first high or low (the “X” point) isn’t breached by any of the other peaks or troughs…and
-
The A-B and C-D moves are slightly bigger than the B-C move
then you can probably call that “A Gartley.”
I find this problematic because with over 2,800 companies, hundreds of commodities, and hundreds of currency and currency-pair spreads traded every day, there are literally tens of thousands of prices changing every minute of every day creating billions of possible price movements that can be examined for Gartley-ness.
In order to test whether the Gartley in fact has a 70% success rate we would basically want to find a bunch of Gartley Patterns and examine how many of them exhibited the expected price move following the D point. This is where RESEARCHER DEGREES OF FREEDOM come in:
Illustrating RDF
It was pretty easy for me to find stock market patterns that were consistent with the Gartley parameters from the ‘textbook’ cases in the previous section. Here are a few examples:
SBUX 4/10/2008 to 5/30/2008
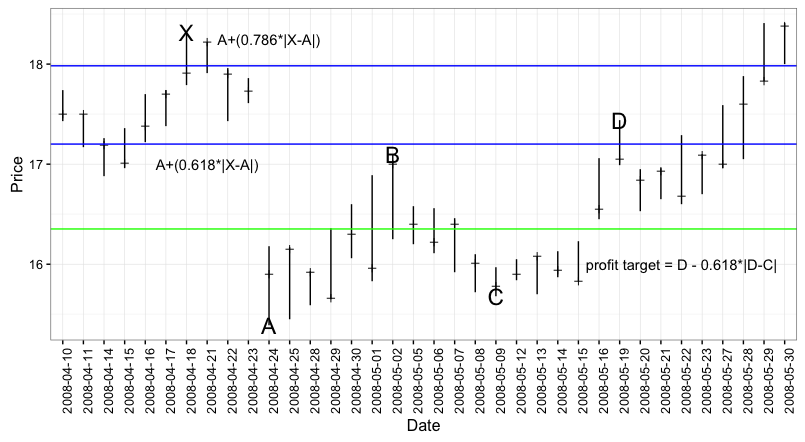
This one has:
- X on 4-18-2008 at $18.32
- A on 4-24-2008 at 15.29
- B on 5-2-2008 at $17.1
- C on 5-9-2008 at $15.68
- D on 5-19-2008 at $17.44
The key Gartley ratios here are:
- \[\frac{|A-B|}{|X-A|} = 0.5836177\]
- \[\frac{|A-D|}{|X-A|} = 0.699659\]
- \[\frac{|C-B|}{|A-B|} = 0.8304094\]
I’m being a little cheeky here because the X - A leg has a pretty ugly gap…however, neither Tom O’Brien, Larry Pesavento, or any of the anonymous internet sources said anything about gaps.
This reminds of the “Bring Me a Rock Game” that developers so often have to play with managers:
Trader: Bring me a Gartley and I’ll show you the perfect trade set up.
Me: OK, what’s a Gartley?
Trader: it has
- the A to B should be a 0.618 retracement of the X to A move
- A to D should be about a 0.786 retrace of the X to A move
- the B to C move should be somewhere in the neighborhood of 0.3 and 0.8 of the A to B move.
Me: Ok, here ya go.
Trader: no that’s not a Gartley, it has a gap.
Me: Ok, got it…
- the A to B should be a 0.618 retracement of the X to A move
- A to D should be about a 0.786 retrace of the X to A move
- the B to C move should be somewhere in the neighborhood of 0.3 and 0.8 of the A to B move.
- and no gaps
Trader: yes.
Me: found one
Trader: no way, that one has \(AD = 0.91XA\).
Me: but the one you showed be before had \(AD = 0.92XA\)
Trader: yes but that’s because the C point was a high volume swing point so we expected it to take a little longer on the CD leg to burn off all the energy.
Me: Ok, got it….So…
- the A to B should be a 0.618 retracement of the X to A move
- A to D should be about a 0.786 retrace of the X to A move
- the B to C move should be somewhere in the neighborhood of 0.3 and 0.8 of the A to B move.
- A to D can sometimes be > 0.7 but only if C is a high volume swing point
Me: here you go
Trader: you just can’t do anything right can you? This chart ends it’s Gartley pattern on the 2nd Wednesday of the month which is options expiration. And EVERYBODY knows options expiration throws the markets into turmoil. All chart patterns are invalid if they terminate on options expiration.
Me: Fuck Me!
The actual bring me a rock game:
Bring me a rock!
OK, any particular kind?
You’re the expert, I trust your judgement.
Sweet, here ‘ya go.
No! Not that rock, I need a round one.
Ok, round rock. Got it. Any particular color?
You’re supposed to be a self-starter. I shouldn’t have to spend this much time directing you. Just bring me the rock I need.
Cool, here is a round rock.
No! This rock is grey and I need a red one.
Got it. Round, red rock. Igneous? Sendimentary? Metamorphic?
Look, I shouldn’t have to babysit you on this. If you can’t get me the rock I need then I’ll have to hire someone who can.
The IBB (Nasdaq Biotech Sector ETF) from Oct, 2012 to to Feb, 2013
ibb<-df.pull(tickers="IBB",startDate='2012-10-01',endDate='2013-03-05')
ggplot(data=ibb, aes(x=factor(date))) +
  theme_bw() +
  geom_linerange(aes(ymin=Low,ymax=High)) +
  theme(axis.text.x=element_text(angle=45))

X <- ibb$High[ibb$date=='2012-10-05']
A <- ibb$Low[ibb$date=='2012-11-09']
B <- ibb$High[ibb$date=='2012-12-12']
C <- ibb$Low[ibb$date=='2012-12-31']
D <- ibb$High[ibb$date=='2013-02-01']


f79 <- A + ((X-A)*0.782)
f60 <- A + ((X-A)*0.618)
fC38 <- B - ((B-A)*0.318)
fC88 <- B - ((B-A)*0.886)

ggplot(ibb, aes(x=factor(date))) +
  theme_bw() +
  geom_linerange(aes(ymin=Low,ymax=High)) +
  annotate("text",x='2012-10-05',y=X+1,label="X",size=6) +
  annotate("text",x='2012-11-09',y=A-1,label="A", size=6) +
  annotate("text",x='2012-12-12',y=B+1,label="B",size=6) +
  annotate("text",x='2012-12-31',y=C-1,label="C",size=6) +
  annotate("text",x='2013-02-01',y=D+1,label="D",size=6) +
#  annotate("text",x='2010-07-02',y=46.30,label="Fib 0.78") +
#  annotate("text",x='2010-07-02',y=45.32,label="Fib 0.618") +
  theme(axis.text.x=element_text(angle=90)) +
  ylab("Price") + xlab("Date") +
  scale_x_discrete(breaks=c('2012-10-01','2012-11-01','2012-12-03',
                            '2013-01-04','2013-02-11'))

Here we have:
-
\(\frac{(B-A)}{(X-A)} = 0.708\)….between the 0.618 and 0.786 levels we want
-
\(\frac{(B-C)}{(B-A)} = 0.47\)…not quite the 0.618 we’re looking for but our first ‘textbook’ Gartley was 0.48 so this one doesn’t seem to be an egregious violation.
-
\(\frac{(D-A)}{(X-A)} = 0.994\). This seems a bit extreme.
This chart should provide any analyst with a little heartburn:
-
Should it be included in our sample at all? i.e. is it a Gartley. The (D-A)/(X-A) = 0.994 seems extreme…but on the other hand one of our ‘textbook’ Gartleys had (D-A)/(X-A) = 0.91. Why is 0.91 ok but 0.99 not ok?
-
If we do include it, do we mark it as a success or failure? This is complicated question because price did decline modestly following the “D” point. So how much price movement does the Gartley say we should look for with the Gartley 222 pattern? In my readings I came across this bit of guidance that says a good price target after identifying a bearish Gartley is D - 0.618(D-C). In this case, that would be around $139. This pattern doesn’t get anywhere near that before running topside of the D point.
So back to RESEARCHER DEGREES OF FREEDOM. My claim is this: if you want to believe there is something magical about the Gartley 222 pattern and that 70% of the time you trade it, it leads to market beating profits you can easily prove yourself right.
For starters suppose I assemble a list of 100 Gartley 222 buy patterns, 50 of which produced profits in excess of D + (0.618(C-D)) and 50 of which did not. Given the ambiguity outlined above regarding what is and is not a Gartley 222 pattern, I could easily assemble 5 experienced traders to comb through my list of the 50 losing Gartleys and tell me why 30 of them aren’t really Gartleys. Then I’d be at 50/70 (71%) and the 70% Gartley success rate claim would win.
This would be pretty nefarious…that kind of ex-post data mining is more like statistical cherry-picking than RESEARCHER DEGREES OF FREEDOM. But there is a more innocent way to prove the 70% rule: simple ask Tom O’Brien or Larry Pesavento to compile the list for me.
You see, when Larry Pesavento says 70% of Gartley trades are profitable what he is really saying is: 70% (or more) of the time that HE HAS EXECUTED a trade off of a Gartley it was profitable. The thing is that Larry Pesavento and Tom O’Brien have been trading 10 hours a day every day for the last 30 years. They probably see a thousand Gartley set-ups a day and may only trade off a couple a week. We have no idea what happened with the 20,000 Gartley set-ups a month that they decided not to act on because:
- volume was weak
- Mercury was in retrograde
- The Baltic Dry Index breached it’s 200 day moving average in a bearish manner
My claim is that even if he wanted to compile the most objective and un-biased list of Gartley 222 set-ups for testing purposes, Larry Pesavento would not be able to. Larry Pesavento has made money off of Gartley-type chart patterns and his brain has filed those under “the Gartley 222 pattern.” Larry has also disregarded thousands of Gartley 222 patterns for various reasons (the Baltic Dry Index, the upcoming OPEC meeting, the current moon phase) and his brain has put those in a file called “Not Gartleys.” So if I backtest a list of 100 historical Gartleys handpicked by Larry himself to see if the 70% rule holds, it will… because Larry Pesavento’s brain has coupled “Gartley” with “made money” and those things can’t be uncoupled.
If you think I’m exaggerating let me provide you with another data point (albeit anecdotal). I have now read about 15 white papers on the subject of Back Testing Gartleys. They almost all look like a white paper I came across from Mark Conway”..I’m not going to provide the link because it looks a little suspect but just Google “backtesting gartley 222 Mark Conway” if you want the .pdf.
This analysis looks vaguely professional…they’re reasonably clear about their experimental set-up and the parameters of their “Back Test” but notice what they are NOT doing. They’re not telling us:
- what stocks/currency pairs/commodities and what time periods are included in thier backtesting data sample
- they’re not providing any link to the data so we can see what the chart patterns that they tested look like
- and most importantly, they’re not telling you anything about how they decided not to include any of the 25,000 + Gartleys that happen on a daily basis that didn’t make it into their study.
Pornography
To their modest credit a lot of experienced traders seem to recognize the inherent bias toward the “I’ll-know-it-when-I-see-it” method of picking out Gartleys.
As far as I can tell The I know-it-when-I-see-it characterization of pornography originated with Justice Potter Stewart’s opinion in the case of Nico Jacobellis v. Ohio (1964)….Stewart’s opinion held that the Constitution protects all obscenity except “hard-core pornography.” He famously wrote, “I shall not today attempt further to define the kinds of material I understand to be embraced within that shorthand description; and perhaps I could never succeed in intelligibly doing so. But I know it when I see it, and the motion picture involved in this case is not that.”
Gartley patterns appear to fall under this same statute. And, in fact, most technical trading education platforms will go as far as to:
-
acknowledge that identifying Gartleys is more art than science, and
-
provide some encouragement along the lines of, “the more you look for them the better you’ll get at identifying them.”
I find this really unsettling for two reasons…actually one reason but I’ll break it into 2 parts:
If I tell you that sea shells on the beach naturally tend to organize themselves into the letter “C”, you might go down to the beach and start looking for sea shells arranged like the letter “C”. I bet dollars to donuts that the longer and harder you look the more occurrences you’ll find.
One reason for this is the Baader-Meinhof Phenomenon. I love this explanation of the Baader-Meinhof Phenomenon:
your friend just told you about that obscure bluegrass-electro-punk band yesterday morning. That afternoon, you ran across one of their albums at a garage sale. Wait a minute — that’s them in that Doritos commercial, too! Coincidence … or conspiracy? More likely, you’re experiencing “frequency illusion,” somewhat better known as the Baader-Meinhof phenomenon
Another reason is RESEARCHER DEGREES OF FREEDOM: I have three candidate occurrences of sea shells. The first one could be a “<” or it could be a “C”; the next one is a backwards “C”…does that count?; the third one is like two “C”s stacked on top of one another…is that 2 “C”s or 1 “E”?
Final Words
I’m actually going to continue this analysis in another post because I want to say some things about the relevant comparisons for backtesting and I want to bash the finance crowd’s bastardization of Fibonacci numbers some more….but before I close out, some final words:
First, my overarching point of this entire post: guys like Tom O’Brien and Larry Pesavento are not trying to swindle you. They absolutely DO make a lot of money trading off the Gartley pattern. The reason why has nothing to do with Fibonacci retracements, 0.618s, 0.786s, or any other ratio of any two prime numbers pulled out of a monkey’s ass. It is because they have been trading in markets 10 hours a day, every day for the last 20 - 30 years. They’ve seen every pattern and permutation of patterns in every equity and currency pair on the planet. Here are some reasons I’ve heard Tom O’Brien advise callers to his radio show not to buy or sell short an equity even though he agreed that it gave “the perfect Gartley buy or sell signal”:
- volume was too low off the reversal
- too much short interest in the stock already which means natural buyers in the market place
- coming into window dressing (a phenomenon where markets tend to be higher the first few days of the month because fund managers only get commissioned when they are fully invested so they have to put all the cash contributions from 401Ks and the like to work)
It is my firm belief that:
-
Many experienced and successful traders really want to help other traders be successful, and
-
It’s human nature to try and assign objective motives to our decision making process. Especially people in fields like finance that are increasingly celebrating data driven decision making, algorithms, and quants.
Experience traders like O’Brien and Pesavento make money. They make money even over the long-haul because price movements in liquid markets like the stock market are not random. They are complex enough not to be predicted with any accuracy over long time scales but, in the short-run, they are governed by buyers and sellers in the market place. If you understand who the big buyers and seller are, and what rules they hold themselves to, you probably can identify some helpful patterns.
For example, many managers of exchange traded funds (like sector funds: XLE for the energy sector, XLK for technology) are bound by pretty rigid rules. They have to buy and sell actual shares of the companies that make up the index that their fund is supposed to track. When the underlying index moves they have to re-weight their portfolio. These funds are not buying 10 or 20 shares, they’re buying hundreds of thousands to millions of shares. They’re buying lots that have the potential to move markets.
To some scientists this whole post will serve as a big chest beating exercise but I assure you that’s not how it’s intended. My claim that experienced traders like Tom O’Briend and Larry Pesevento are not responding to quantifiable metrics but rather to ‘feel’ that has been developed over decades of trading in various equity and commodity markets is not meant as a knock on those guys.
Tom O’Brien is a hustler…in the very best way. He started out pushing a fucking hot-dog cart around Boston and now he runs a plethora of profitable funds. It’s sure as shit not because the 0.618 Fibonacci retracement has any natural or intrinsic meaning in markets…it’s because he’s worked day-in and day-out to try and understand the complexity of markets.
Can you make money trading stocks, currancies, commodities? In my opinion, sure, if you’re willing to work diligently at it. Some might find that disturbing. I find it pretty comforting…comparative advantage and all that.