
Accessing financial data from the sec part 1
This post is about downloading financial statements from the SEC’s EDGAR database programatically. The overarching motivation is that I have a bunch of companies that I believe are fundamentally similar (in this case I’m dealing with 62 publicly traded restaurants/restaurant holding companies) and I want to be able to compare thier financials over time to determine the strongest players in the industry/space.
Quick background
Publicly traded companies are required by law to submit financial disclosures to the Securities and Exchange Commission. There are tons of filing documents that companies file with the SEC:
- SC 13G/A forms: statement of acquisition of beneficial ownership by individuals
- S-8 POS: Securities to be offered to employees in employee benefit plans
- 10-K: Annual financial report
- 10-Q: Quarterly financial report
- etc, etc, etc.
For a dabbler like myself the most digestable info is contained in the 10-K filings. This a filing that includes income statements, balance sheet info, and cash flow statement on an annual basis.
What I’m really trying to do here, on a global level, is collect the information in the Income Statement portion of the 10-K filings for a bunch of companies, over a bunch of years.
A quick rant
I used to get selected company financials from Quandl. Quandl now charges around $1,200 per year per series for thier financial data so you can forget anything good I ever said about Quandl. They suck all the dicks.
Lots of financial services (Fidelity, Etrade, etc) will allow you to pull company 10-K filings and other financial disclosures…but you pretty much have to do it one request at a time. A prohibitively expensive proposition for anyone looking to compare income, balance sheets, or cash flow statement across companies and through time.
Executive Summary
So far I have found 3 ways to do this and none of them is/are perfect…but they all get reasonably close to what I really want. There are two R libraries that offer pretty easy access to SEC filings and a few methods in Python. This post is primarily about the financial reporting in R: finreportr library. I outline all methods I’ve tested below for completeness.
The finstr solution that I’ll be working with in my next post also relies on the R package edgarWebR to do some of the webcrawling to find the right .xml file to download and parse.
I have also test a Python solution that I’ll write-up for the 3rd post in this series. Although there is a Python library called secEDGAR, I honestly wouldn’t bother with it. If you’re going the Python route it makes more sense to just write the EDGAR crawler yourself.
Set up
I have a list of 62 publicly traded restaurants/restaurant groups that I want 10-K filings for. More specifically, I’d like to get an idea of the revenue generation of these companies.
Here are the companies with ticker symbols and full names:
stores <- data.frame(ticker=c('BJRI','BLMN','BUWR','BOBE','EAT','BUCA','BWLD','BKC',
'CPKI','CBO','CRW','TAST','CEC','CMG','CHUY','CKR','CBRL','DRI','PLAY','DFRG','DENN',
'DIN','DPZ','DNKN','JOES.OB','BAGL','LOCO','DAVE','FCCG.OB','FOGO','BAJA','HABT','KKD','LNY', 'LGNS','LUB','MSSR','MCD','MRT','NATH','NDLS','CHUX','PNRA','PFCB','PZZI','PBPB','RRGB',
'RICK','RUBO','RT','RUTH','SHAK','SWRG','SONC','SBUX','TXRH','SNS','THI','WEST','WING','YUM','ZOES'),
                     name=c("BJ's","Bloomin' Brands","Blue Water Restaurant Group","Bob Evans Farms, Inc", "Brinker International, Inc", "Buca Inc", "Buffalo Wild Wings, Inc", "Burger King Holdings","California Pizza Kitchen","Caribou Coffee Co","Carlson Restaurants Worldwide","Carrols Restaurant Group, Inc","CEC Entertainment, Inc","Chiptole Mexican Grill","Chuy's Holdings","CKE Restaurants, Inc","Cracker Barrel Old Country Store, Inc.",'Darden Restaurants, Inc', "Dave & Busters Entertainment, Inc","Del Frisco's Restaurant Group","Denny's Corp","DineEquity, Inc","Domino's Pizza, Inc.","Dunkin Brands Group","Eat At Joe's Ltd","Einstein Noah Restaurant Group, Inc","El Pollo Loco","Famous Dave's of America, Inc","Fog Cutter Capital Group Inc","Fogo De Chao, Inc.","Fresh Enterprises Inc","Habit Restaurants Inc","Krispy Kreme Doughnuts, Inc","Landry's Restaurants, Inc","Logan's Roadhouse Inc","Luby's, Inc","McCormick & Schmick's Seafood Restaurants, Inc","McDonald's Corporation","Morton's Restaurant Group Inc","Nathan's Famous, Inc","Noodles & Co","O'Charley's Inc","Panera Bread Co","P.F. Chang's China Bistro, Inc","Pizza Inn, Inc","Potbelly Corp","Red Robin Gourmet Burgers, Inc","Rick's Cabaret International, Inc","Rubio's Restaurants Inc","Ruby Tuesday, Inc","Ruth's Hospitality Group, Inc","Shake Shack","Smith and Wollensky","Sonic Corp","Starbuck Corporation","Texas Roadhouse, Inc","The Steak and Shake Company","Tim Horton's, Inc", "Western Sizzlin Corporation","Wingstop Inc","Yum Brands","Zoe's Kitchen"))
Here are all the libraries that I will use:
library(dplyr)
library(ggplot2)
library(finreportr)
library(data.table)
library(ggthemes)
Step-by-Step
The finreportr package does a pretty nice job of getting annual 10-K filings. It’s very easy to use and returns well formatted data. It breaks down in some key areas which kinda sucks.
A good example:
As an example let’s look at the first company on my list, “BJ’s Restaurants Inc (BJRI)”. With the finreportr package we just pop that ticker symbol into a wrapper function called GetIncome() and we’re golden:
inc <- GetIncome('BJRI',2012)

str(inc)
'data.frame':	99 obs. of  5 variables:
 $ Metric   : chr  "Sales Revenue, Goods, Net" "Sales Revenue, Goods, Net" "Sales Revenue, Goods, Net" "Sales Revenue, Goods, Net" ...
 $ Units    : chr  "Unit1" "Unit1" "Unit1" "Unit1" ...
 $ Amount   : chr  "620943000" "144862000" "513860000" "121686000" ...
 $ startDate: chr  "2010-12-29" "2010-12-29" "2009-12-30" "2009-12-30" ...
 $ endDate  : chr  "2012-01-03" "2011-03-29" "2010-12-28" "2010-03-30" ...

head(inc)
                     Metric Units    Amount  startDate    endDate
1 Sales Revenue, Goods, Net Unit1 620943000 2010-12-29 2012-01-03
2 Sales Revenue, Goods, Net Unit1 144862000 2010-12-29 2011-03-29
3 Sales Revenue, Goods, Net Unit1 513860000 2009-12-30 2010-12-28
4 Sales Revenue, Goods, Net Unit1 121686000 2009-12-30 2010-03-30
5 Sales Revenue, Goods, Net Unit1 426707000 2008-12-31 2009-12-29
6 Sales Revenue, Goods, Net Unit1 152887000 2011-03-30 2011-06-28

unique(inc$Metric)

 [1] "Sales Revenue, Goods, Net"
 [2] "Cost of sales"
 [3] "Labor and benefits"
 [4] "Occupancy And Operating Costs"
 [5] "General and administrative"
 [6] "Depreciation and amortization"
 [7] "Restaurant opening"
 [8] "Loss on disposal of assets"
 [9] "Payments for Legal Settlements"
[10] "Costs and Expenses"
[11] "Operating Income (Loss)"
[12] "Interest income"
[13] "Interest expense"
[14] "Gain (Loss) on Investments"
[15] "Other income, net"
[16] "Nonoperating Income (Expense)"
[17] "Income (Loss) from Continuing Operations before Equity Method Investments, Income Taxes, Extraordinary Items, Noncontrolling Interest"
[18] "Income tax expense"
[19] "Net Income (Loss) Attributable to Parent"
[20] "Earnings Per Share Basic"
[21] "Diluted"
[22] "Weighted Average Number Of Shares Outstanding Basic"
[23] "Weighted Average Number Of Diluted Shares Outstanding"
All we needed to supply the function with was a ticker symbol and a year to filter on and it returns us a really cool formatted table. Here I’ve chosen the GetIncome() method which pulls out information from the “Consolidated Statements of Income” portion of the 10-K filing.
The finreportr package also has methods for:
- GetBalanceSheet()
- GetCashFlow()
which will return information from the “Consolidated Balance Sheet” and the “Consolidated Statement of Cash Flow” respectively.
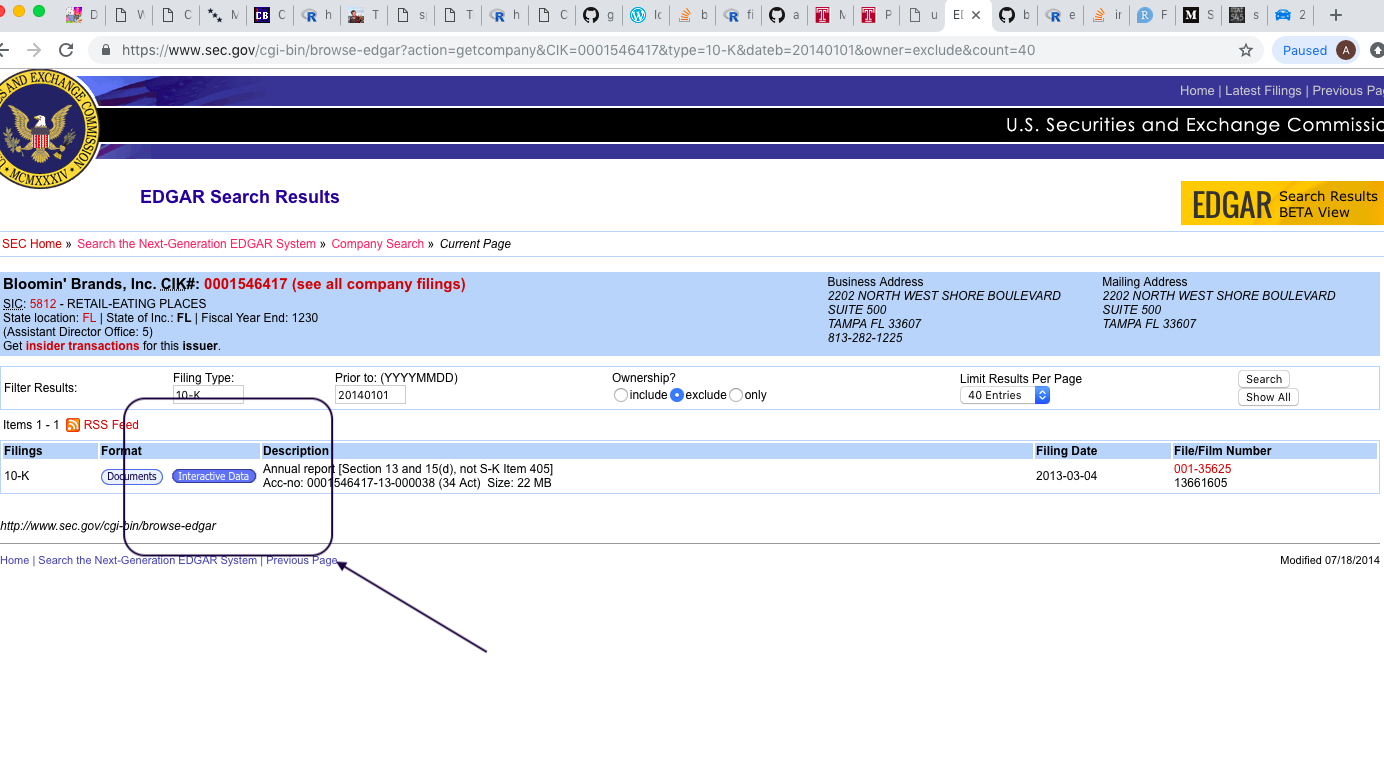
As a quick accuracy check, and to cultivate a good understanding of where the data come from, I recommend toggling over to the SEC’s EDGAR interface and:
- use the “Fast Search” (top right, just under the header on the landing page).
- enter the ticker symbol “BJRI”
- filter by filing type = “10-K”
- enter the value “20130101” in the “Prior to” filter box
The top result returned should be for a report with:
- filing date = 2012-02-28
- file/film number = 000-21423 / 12643962
Next:
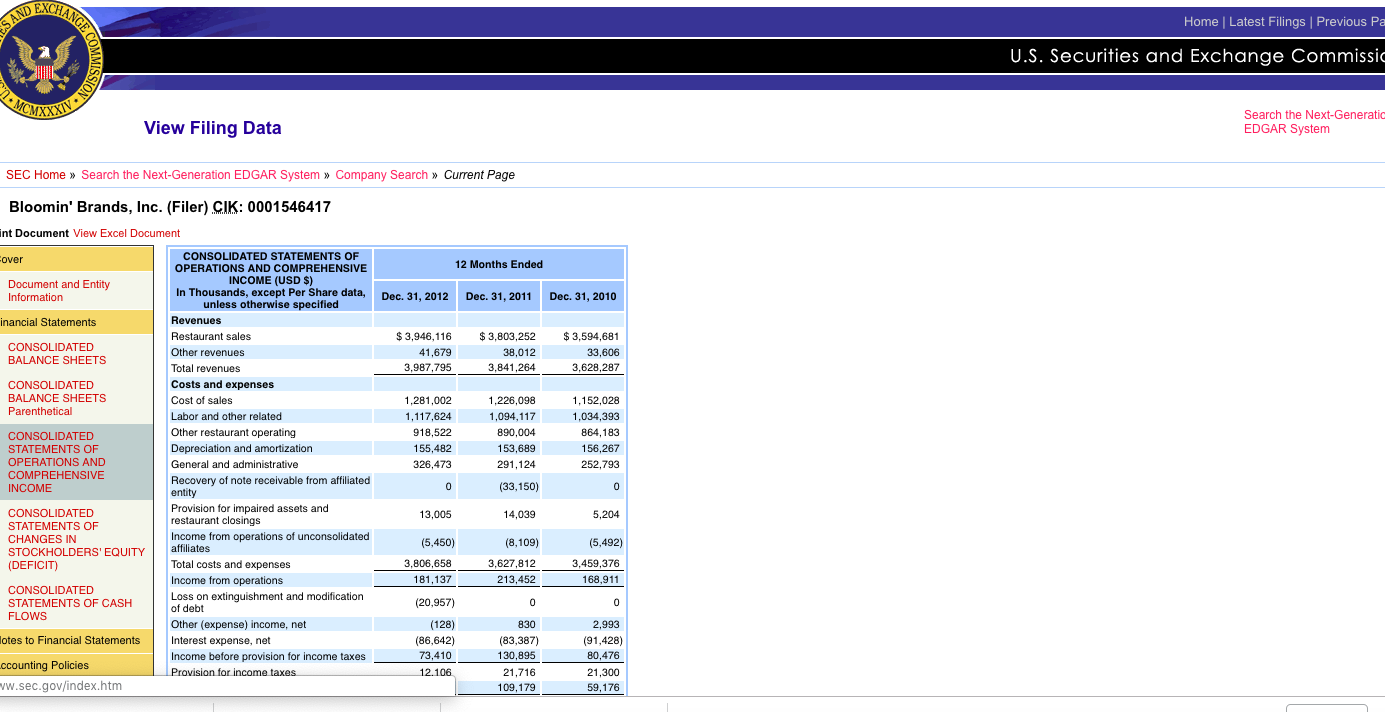
- Use the “interactive data” radio button
- Look in the left column table for “financial statements” > “consolidated statements of income”
The resulting table should show a value for “Revenues” of $620,943 for the period ending Jan. 03, 2012. Notice that this matches the value in the first row of the data frame inc in the code block above. Ok, I know that was a little tedious but at least we’ve verified that our code pulled out the same value that we would have gotten if we would have gone into the EDGAR database manually and looked for the BJ’s Restaurants 10-K filing from Jan. of 2012.
One final wrinkle to mention here before moving on: although the finreportr documentation mentions only having the capability of searching annual 10-K filings…it’s clear that we got some quarterly filings returned:
inc <- tbl_df(inc) %>% group_by(startDate,endDate) %>% filter(row_number()==1)

inc

# A tibble: 11 x 5
# Groups:   startDate, endDate [11]
   Metric                    Units Amount    startDate  endDate
   <chr>                     <chr> <chr>     <chr>      <chr>
 1 Sales Revenue, Goods, Net Unit1 620943000 2010-12-29 2012-01-03
 2 Sales Revenue, Goods, Net Unit1 144862000 2010-12-29 2011-03-29
 3 Sales Revenue, Goods, Net Unit1 513860000 2009-12-30 2010-12-28
 4 Sales Revenue, Goods, Net Unit1 121686000 2009-12-30 2010-03-30
 5 Sales Revenue, Goods, Net Unit1 426707000 2008-12-31 2009-12-29
 6 Sales Revenue, Goods, Net Unit1 152887000 2011-03-30 2011-06-28
 7 Sales Revenue, Goods, Net Unit1 130497000 2010-03-31 2010-06-29
 8 Sales Revenue, Goods, Net Unit1 151425000 2011-06-29 2011-09-27
 9 Sales Revenue, Goods, Net Unit1 128781000 2010-06-30 2010-09-28
10 Sales Revenue, Goods, Net Unit1 171769000 2011-09-28 2012-01-03
11 Sales Revenue, Goods, Net Unit1 132896000 2010-09-29 2010-12-28
>
Notice that we have some metrics where the startDate and endDate are separated by about a year…and others where the start and end dates are separated by a couple months.
Not a big deal but definitely something to keep in mind for our post processing steps.
sometimes things go wrong
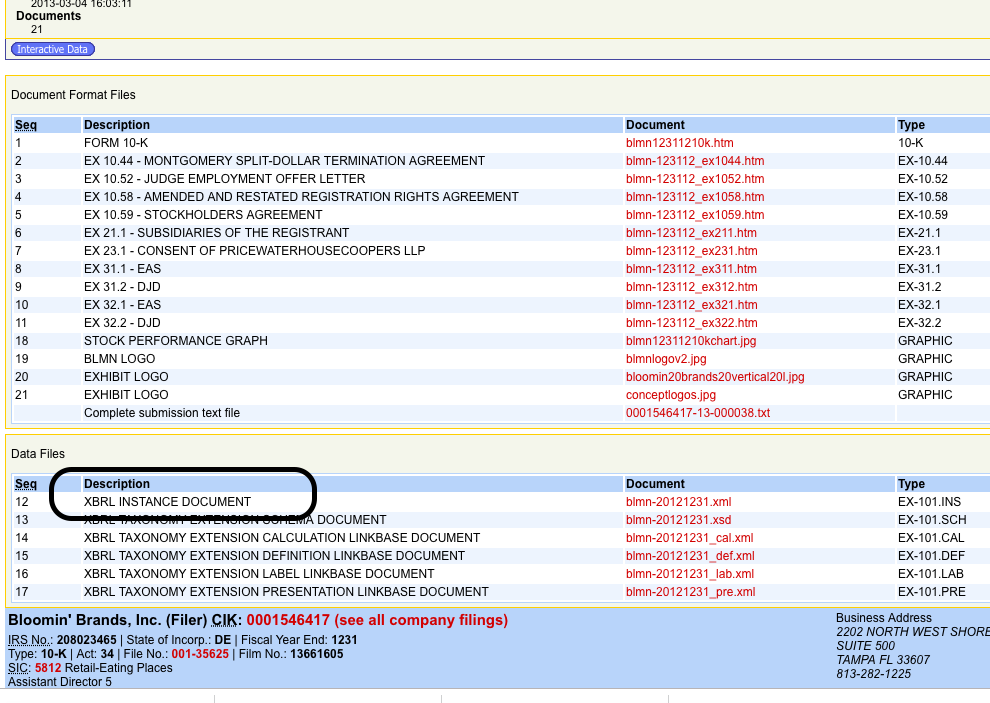
My first attempt at looping through all 62 ticker symbols to get the Consolidated Income Statements was rejected with extreme prejudice as the GetIncome() function threw an error when trying to retrieve info for the “Bloomin’ Brands” Company (BLMN). After much troubleshooting, I’m convinced that the error is somewhere in the finreportr package.
Here is why:
I can use the SEC’s online EDGAR interface to manually navigate to a 10-K filing from Bloomin’ Brands with a filing date of 3/4/2013:
The error I get from the GetIncome() function in the finreportr library suggests that the function can’t find an XBRL document type to parse:
GetIncome('BLMN',2014)
Error in GetFinancial(income.descriptions, symbol, year) :
  no XBRL-format filings detected
However, looking at the document tree for the 10-K filing on 3/4/2013 it appears that there is indeed an XBRL Instance document in the index library
A hack
If you are willing to accept that sometimes you might not get data for a company for mysterious reasons then you could use the hack that I employ below. Basically, just wrap the function call in a try() statement and
- if there is data grab it
- if the function throws an error say ‘fuck it Mersch’ and moveon.org
test.list <- list()
for(i in 1:nrow(stores)){

  tmp <- try(GetIncome(stores$ticker[i],2012),TRUE)

  if(isTRUE(class(tmp)=='try-error')){
    test.list[[i]] <- data.frame(Metric=NA,Units=NA,Amount=NA,startDate=NA,endDate=NA,ticker=stores$ticker[i])
  }else if (nrow(tmp)==0){
    test.list[[i]] <- data.frame(Metric=NA,Units=NA,Amount=NA,startDate=NA,endDate=NA,ticker=stores$ticker[i])

  }else{
    tmp$ticker <- stores$ticker[i]
    test.list[[i]] <- tmp

  }
}

inc1 <- data.frame(rbindlist(test.list))
Two quick notes:
1
The date entry in the GetIncome() function will try to grab all the annual 10-K filings before the year you pass to the argument. Example: in the code above I passed the year 2012 and the function collected info on annual 10-K filings prior to 2012. Technically, if one wanted all 10-K filings from (for example) Buffalo Wild Wings one could try
GetIncome('BWLD',2018)
My experience has been that this is a bad idea. It seems that GetIncome() will only return a certain amount of data. That is, if I do
GetIncome('BWLD',2012)
I get info back to 10-k filings from 2008. But if specify 2018 instead of 2012 I only get 10-K filings back to about 2013. So, if you really want all the data from a companies various annual 10-K filings, I recommend making multiple calls to the GetIncome() function with different dates…then maybe post filtering results for duplicate annual filings.
2
A lot of my GetIncome() requests time out. I doubt this is attributable to the finreportr package. I suspect it’s probably because the SEC is getting crawled by thousands of finance bots every second of every day and they just can’t handle it.
On a general note: accessing public info on 10-K filings through the SEC struck me as shockingly difficult. I can’t believe the SEC doesn’t offer an API or at least a way to just clone the entire database…which would result in a lot less activity hitting their servers from people scraping disclosures one-by-one.
End-to-End
So here is a quick high-level analysis I did and the code block I used to achieve it. As a reminder: the question at hand is:
“Of all the publicly traded restaurants, are there exceptionally good or exceptionally bad ones?”
To be more precise:
“Whose sales are going down when everybody elses’ are going up? Or whose sales are going up faster than their competitors?”
Spoiler alert: you won’t find the answer here. Turns out these data need an ass-pile of post-processing to be useful and I haven’t had time to scrub them into submission just yet.
Start by just getting some data
#-------------------------------------------------------------
# write the loop as a function so I can iterate over years...
# remember, the GetIncome() function should be pulling everything BEFORE
# the year parameter supplied to the function...so no need to do for literally every year.

get10K <- function(year){
  test.list <- list()
  for(i in 1:nrow(stores)){

    tmp <- try(GetIncome(stores$ticker[i],2018),TRUE)

    if(isTRUE(class(tmp)=='try-error')){
      test.list[[i]] <- data.frame(Metric=NA,Units=NA,Amount=NA,startDate=NA,endDate=NA,ticker=stores$ticker[i])
    }else if (nrow(tmp)==0){
      test.list[[i]] <- data.frame(Metric=NA,Units=NA,Amount=NA,startDate=NA,endDate=NA,ticker=stores$ticker[i])

    }else{
      tmp$ticker <- stores$ticker[i]
      test.list[[i]] <- tmp

    }
  }

inc <- data.frame(rbindlist(test.list))
}
#---------------------------------------------------------------------

#---------------------------------------------------------------------
#call the function above and bind the results
df <- tbl_df(rbind(get10k(year=2012),get10k(year=2016,get10k(year=2018))))
#----------------------------------------------------------------------


#----------------------------------------------------------------------------------------
#remove any dups: again, the 'year' filter is supposed to pull 10-K filing BEFORE the
# supplied year.  So by calling the GetIncome() function for the same company for multiple
# years there is a risk of getting duplicate info....so we want to filter that out.

df <-  df %>% group_by(ticker,Metric,startDate,endDate) %>%
  filter(row_number()==1)

# also, remove NA values....in order to get my loop to work without breaking I had to
# insert NA rows for each company/year combo where GetIncome() did not return data

df <- df %>% filter(is.na(Metric)==F)
#-----------------------------------------------------------------------------------------

#------------------------------------------------------------------------
#finally, I want to add the info from my original 'stores' data frame back in
df <- df %>% inner_join(stores,by=c('ticker'))
#------------------------------------------------------------------------


str(df)
> str(df)
Classes ‘tbl_df’, ‘tbl’ and 'data.frame':	7540 obs. of  11 variables:
 $ X        : int  1 2 3 4 5 6 7 8 9 10 ...
 $ Metric   : chr  "Sales Revenue, Goods, Net" "Sales Revenue, Goods, Net" "Sales Revenue, Goods, Net" "Sales Revenue, Goods, Net" ...
 $ Units    : chr  "Unit1" "Unit1" "Unit1" "Unit1" ...
 $ Amount   : num  6.21e+08 1.45e+08 5.14e+08 1.22e+08 4.27e+08 ...
 $ startDate: chr  "12/29/10" "12/29/10" "12/30/09" "12/30/09" ...
 $ endDate  : chr  "1/3/12" "3/29/11" "12/28/10" "3/30/10" ...
 $ ticker   : chr  "BJRI" "BJRI" "BJRI" "BJRI" ...
 $ name     : chr  "BJ's" "BJ's" "BJ's" "BJ's" ...
 $ startdate: Date, format: "2010-12-29" "2010-12-29" "2009-12-30" ...
 $ enddate  : Date, format: "2012-01-03" "2011-03-29" "2010-12-28" ...
 $ endyear  : num  2012 2011 2010 2010 2009 ...
In case I have not yet made this abundantly clear: this method is not perfect. If you are able to execute my code, there is a high likelihood that your final data frame will differ slightly from mine. This is partially because the SEC is really shitty and will probably time out at least few of your url requests even though there is data there to return AND partially because the GetIncome() function of finreportr is (in my experience) temperamental.
Let’s see what data we got
First I’m just going to plot every company on the original list and mark whether or not our code retrieved data for the company for the years 2008 - 2018.
#----------------------------------------------------------------------
#count the number of entries for each company
comp.count <- df %>% group_by(name,endyear) %>% filter(row_number()==1) %>%
                 mutate(present=1)

#merge this with a store/year data frame
comp.year <- rbind(data.frame(stores,endyear=2009),
data.frame(stores,endyear=2010),
data.frame(stores,endyear=2011),
data.frame(stores,endyear=2012),
data.frame(stores,endyear=2013),
data.frame(stores,endyear=2014),
data.frame(stores,endyear=2015),
data.frame(stores,endyear=2016),
data.frame(stores,endyear=2017),
data.frame(stores,endyear=2018))

comp.year <- comp.year %>% left_join(comp.count,by=c('name','ticker','endyear')) %>%
                mutate(present=ifelse(is.na(present),0,1))
ggplot(comp.year,aes(x=name,y=endyear,shape=factor(present),color=factor(present))) + geom_point() +
+   coord_flip() + theme(axis.text.x=element_text(size=6,colour='black')) + theme_bw() + xlab("") + ylab("") + scale_shape_manual(values =c(1,8)) + scale_color_manual(values =c('red','black'))
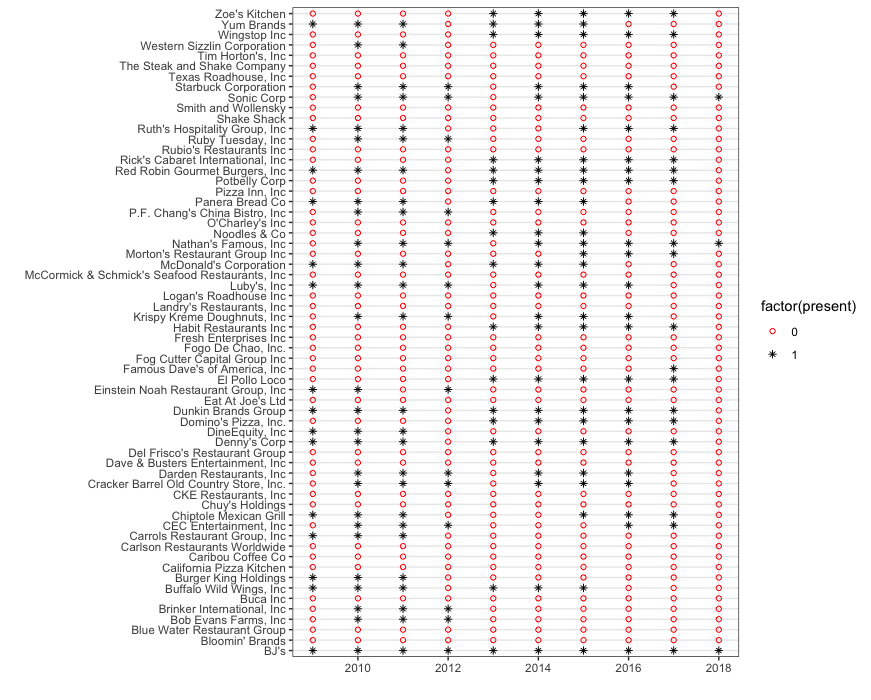
Kind of a bummer! My routine did not pull data for very many of the 60-someodd publicly traded companies on my list. At the risk of beating a long-dead horse: this sad success rate is a function of
- the SEC warehouses data in a shitty unstandardized way and
- the finreportr package clearly isn’t very robut to idiosyncracies across 10-K filings.
There are a few spots where we might want to go back and fill in a couple blanks by hand. For instance:
-
Starbucks has data for 2009 - 2018 but is missing 2008. I bet the 2008 data is there and we could probably grab it by just going to EDGAR directly.
-
Similarly, Dunkin Brands has data for almost every year except 2012…this suggests to me that maybe one of our requests just timed-out and we could fill that gap in by hand (if we really wanted to).
-
Panera Break, Sonic, Yum Brands, and a few others also have the property that almost all the data is there but an odd year is missing. I bet those could be filled in by hand.
Another spoiler alert: I’m not going to fill those in by hand. I would rather spend my time looking for a more stable solution that is just better at scraping the data.
Let’s see what kind of metrics we have access to
The data I pulled include over 500 distinct metrics pulled from the consolidate income statements
> length(unique(df$Metric))
[1] 507

> unique(df$Metric)
  [1] "Sales Revenue, Goods, Net"
  [2] "Cost of sales"
  [3] "Labor and benefits"
  [4] "Occupancy And Operating Costs"
  [5] "General and administrative"
  [6] "Depreciation and amortization"
  [7] "Restaurant opening"
  [8] "Loss on disposal of assets"
  [9] "Payments for Legal Settlements"
 [10] "Costs and Expenses"
 [11] "Operating Income (Loss)"
 [12] "Interest income"
 [13] "Interest expense"
 [14] "Gain (Loss) on Investments"
 [15] "Other income, net"
 [16] "Nonoperating Income (Expense)"
 [17] "Income (Loss) from Continuing Operations before Equity Method Investments, Income Taxes, Extraordinary Items, Noncontrolling Interest"
 [18] "Income tax expense"
 [19] "Net Income (Loss) Attributable to Parent"
 [20] "Earnings Per Share Basic"
 [21] "Diluted"
 [22] "Weighted Average Number Of Shares Outstanding Basic"
 [23] "Weighted Average Number Of Diluted Shares Outstanding"
 [24] "Net Sales"
 [25] "Operating wage and fringe benefit expenses"
 [26] "Other operating expenses"
 [27] "Selling, general and administrative expenses"
 [28] "Depreciation and amortization expense"
 [29] "Operating Income"
There are 86 distinct metrics involving the terms “revenue”,”sales”,”food”, and “restaurant”:
sales.metrics.full <- unique(c(unique(df$Metric)[grep("Revenue",unique(df$Metric))],
                               unique(df$Metric)[grep("revenue",unique(df$Metric))],
                               unique(df$Metric)[grep("sales",unique(df$Metric))],
                               unique(df$Metric)[grep("Sales",unique(df$Metric))],
                               unique(df$Metric)[grep("Restaurant",unique(df$Metric))],
                               unique(df$Metric)[grep("restaurant",unique(df$Metric))],
                               unique(df$Metric)[grep("food",unique(df$Metric))],
                               unique(df$Metric)[grep("Food",unique(df$Metric))]))
> sales.metrics.full
 [1] "Sales Revenue, Goods, Net"
 [2] "Revenues"
 [3] "Revenue, Net"
 [4] "Franchise And Property Revenues"
 [5] "Sales Revenue, Net"
 [6] "Revenue"
 [7] "Franchise Revenue"
 [8] "Food and Beverage Revenue"
 [9] "Financial Services Revenue"
[10] "Cost of Revenue"
[11] "Operating Leases, Income Statement, Lease Revenue"
[12] "Other Revenue, Net"
[13] "Franchisor Revenue"
[14] "Contracts Revenue"
[15] "Vending Revenue"
[16] "Sales Revenue Services Net"
[17] "Sales Revenue Goods Net"
[18] "Royalty Revenue"
[19] "Franchise Royalties and Fees and Other Revenues"
[20] "Alcoholic Beverages Revenue"
[21] "Food and Merchandise Revenue"
[22] "Sales Revenue, Services, Net"
[23] "Other Revenues"
[24] "Other Sales Revenue Net"
[25] "Revenues, Total"
[26] "Licensed Store Revenue"
[27] "Revenue from Franchisor Owned Outlets"
[28] "Sales Revenue Net"
[29] "us-gaap_Revenues"
[30] "Revenue From Franchise Royalties And Fees"
[31] "Other Cost of Operating Revenue"
[32] "Licensing and Other Revenue"
[33] "Operating Leases Income Statement Lease Revenue"
[34] "Food And Beverage Revenue"
[35] "Franchise royalty revenues and fees"
[36] "Total revenues"
[37] "Total revenue"
[38] "Franchise and license revenue"
[39] "Costs of franchise and license revenue"
[40] "Manufacturing and commissary revenues"
[41] "Restaurant licensing revenues"
[42] "Restaurant sales and operating revenue"
[43] "Franchise revenue"
[44] "Lease revenue"
[45] "Net revenue"
[46] "Vending revenue"
[47] "Service revenues"
[48] "Franchise fee revenue"
[49] "Business segment revenues"
[50] "Cost of sales"
[51] "Restaurant sales"
[52] "Food and beverage sales"
[53] "Entertainment and merchandise sales"
[54] "Company restaurant sales"
[55] "Restaurant sales, net"
[56] "Net Sales"
[57] "Losses (Gains) on Sales of Assets and Asset Impairment Charges"
[58] "Food and Beverage, Cost of Sales"
[59] "Food And Beverage Cost Of Sales"
[60] "Restaurant Sales"
[61] "Sales"
[62] "Fresh Dough And Other Product Sales To Franchisees"
[63] "Fresh Dough And Other Product Cost Of Sales To Franchisees"
[64] "Sales and marketing"
[65] "Gain Loss On Sales Of Assets And Asset Impairment Charges"
[66] "Sales of alcoholic beverages"
[67] "Sales of food and merchandise"
[68] "(Gain) loss on Sales of Assets and Asset Impairment Charges"
[69] "Restaurant opening"
[70] "Restaurant Labor"
[71] "Restaurant Expenses"
[72] "Restaurant wages and related expenses (including stock-based compensation expense of $21, $51, $49 and $156, respectively)"
[73] "Total Company Owned Restaurant Cost"
[74] "Restaurant operating expenses"
[75] "Company Owned Restaurant Expenses"
[76] "Asset Disposals, Closure Costs and Restaurant Impairments"
[77] "Company Restaurant Expenses"
[78] "Other restaurant operating expenses"
[79] "Other restaurant operating costs"
[80] "Cost of food and beverage (exclusive of items shown separately below)"
[81] "Food, beverage and packaging"
[82] "Food And Paper Costs"
[83] "Food and beverage costs"
[84] "Food and packaging"
[85] "Consumer Packaged Goods Foodservice Other"
[86] "Food and merchandise sold"
In order to answer my main question of interest:
“Are there companies doing well when everybody else is doing shitty or vice versa?”
I would like to find some comparable companies reporting on the same revenue or sales metric and look at them side-by-side over time.
Claim: This is unreasonably hard to do using the data I scraped from 10-K filings.
Proof: We use a regular expression search to find any and all metrics related to Revenue, Sales, Restaurant, or Food. Then we look at instances where Buffalo Wild Wings and Wingstop (two ostensibly comparable purveyors of fine wings and mead) report data on the same revenue/sales category:
sales.metrics.full <- unique(c(unique(df$Metric)[grep("Revenue",unique(df$Metric))],
                               unique(df$Metric)[grep("revenue",unique(df$Metric))],
                               unique(df$Metric)[grep("sales",unique(df$Metric))],
                               unique(df$Metric)[grep("Sales",unique(df$Metric))],
                               unique(df$Metric)[grep("Restaurant",unique(df$Metric))],
                               unique(df$Metric)[grep("restaurant",unique(df$Metric))],
                               unique(df$Metric)[grep("food",unique(df$Metric))],
                               unique(df$Metric)[grep("Food",unique(df$Metric))]))

wings <- df %>% filter(ticker %in% c('WING','BWLD') & Metric %in% sales.metrics.full)

ggplot(wings,aes(x=ticker,y=endyear)) +
  geom_point(shape=8) + facet_wrap(~Metric) +
  theme_bw() + scale_y_continuous(breaks=c(2010,2012,2014,2016,2018)) +
   xlab("") + ylab("")
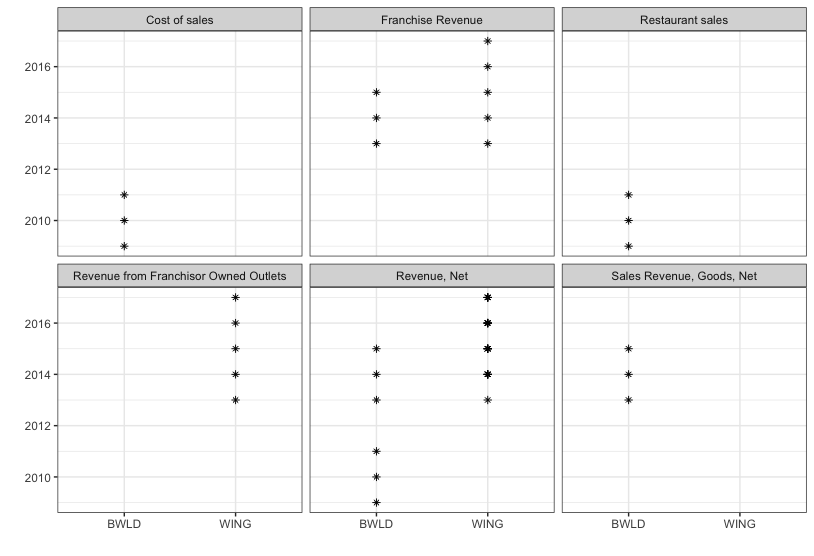
Notice that 2013-2015 appears to be the only time period of overlap between Buffalo Wild Wings and Wingstop…and, of all the different ways the two companies report revenues, only the categories “Revenues, Net” and “Franchise Revenues” overlap.
Summary
The finreportr package is REALLY easy to use. It is not very comprehensive and not very robust to formatting idiosyncracies from the SEC filings. If you want to look at one company at a time, this will probably do an OK job for you…if you’re looking for more than that than I suggest looking elsewhere.